Implementation of Optical Trapezoid Model (OPTRAM) with Sentinel 2
The Optical Trapezoid Model (OPTRAM) was developed to overcome the limitations of the Thermal-Optical Trapezoid Model (TOTRAM), i.e., non aplicability to satellites that do not provide thermal data, and the requirement of parametrization for each individual date. Based on Short Wave Infrared Reflectance (SWIR), Normalized Difference Vegetation Index (NDVI) and in situ measurements at surface level, the OPTRAM has demostrated to be a significant advance for remote sensing of soil moisture with great importance to undestand seasonal dynamics, water resource planning and agricultural production.
The present work its a implementation of the OPTRAM based on the paper sadegui et al 2017, however some differences are worth mentioning:
-
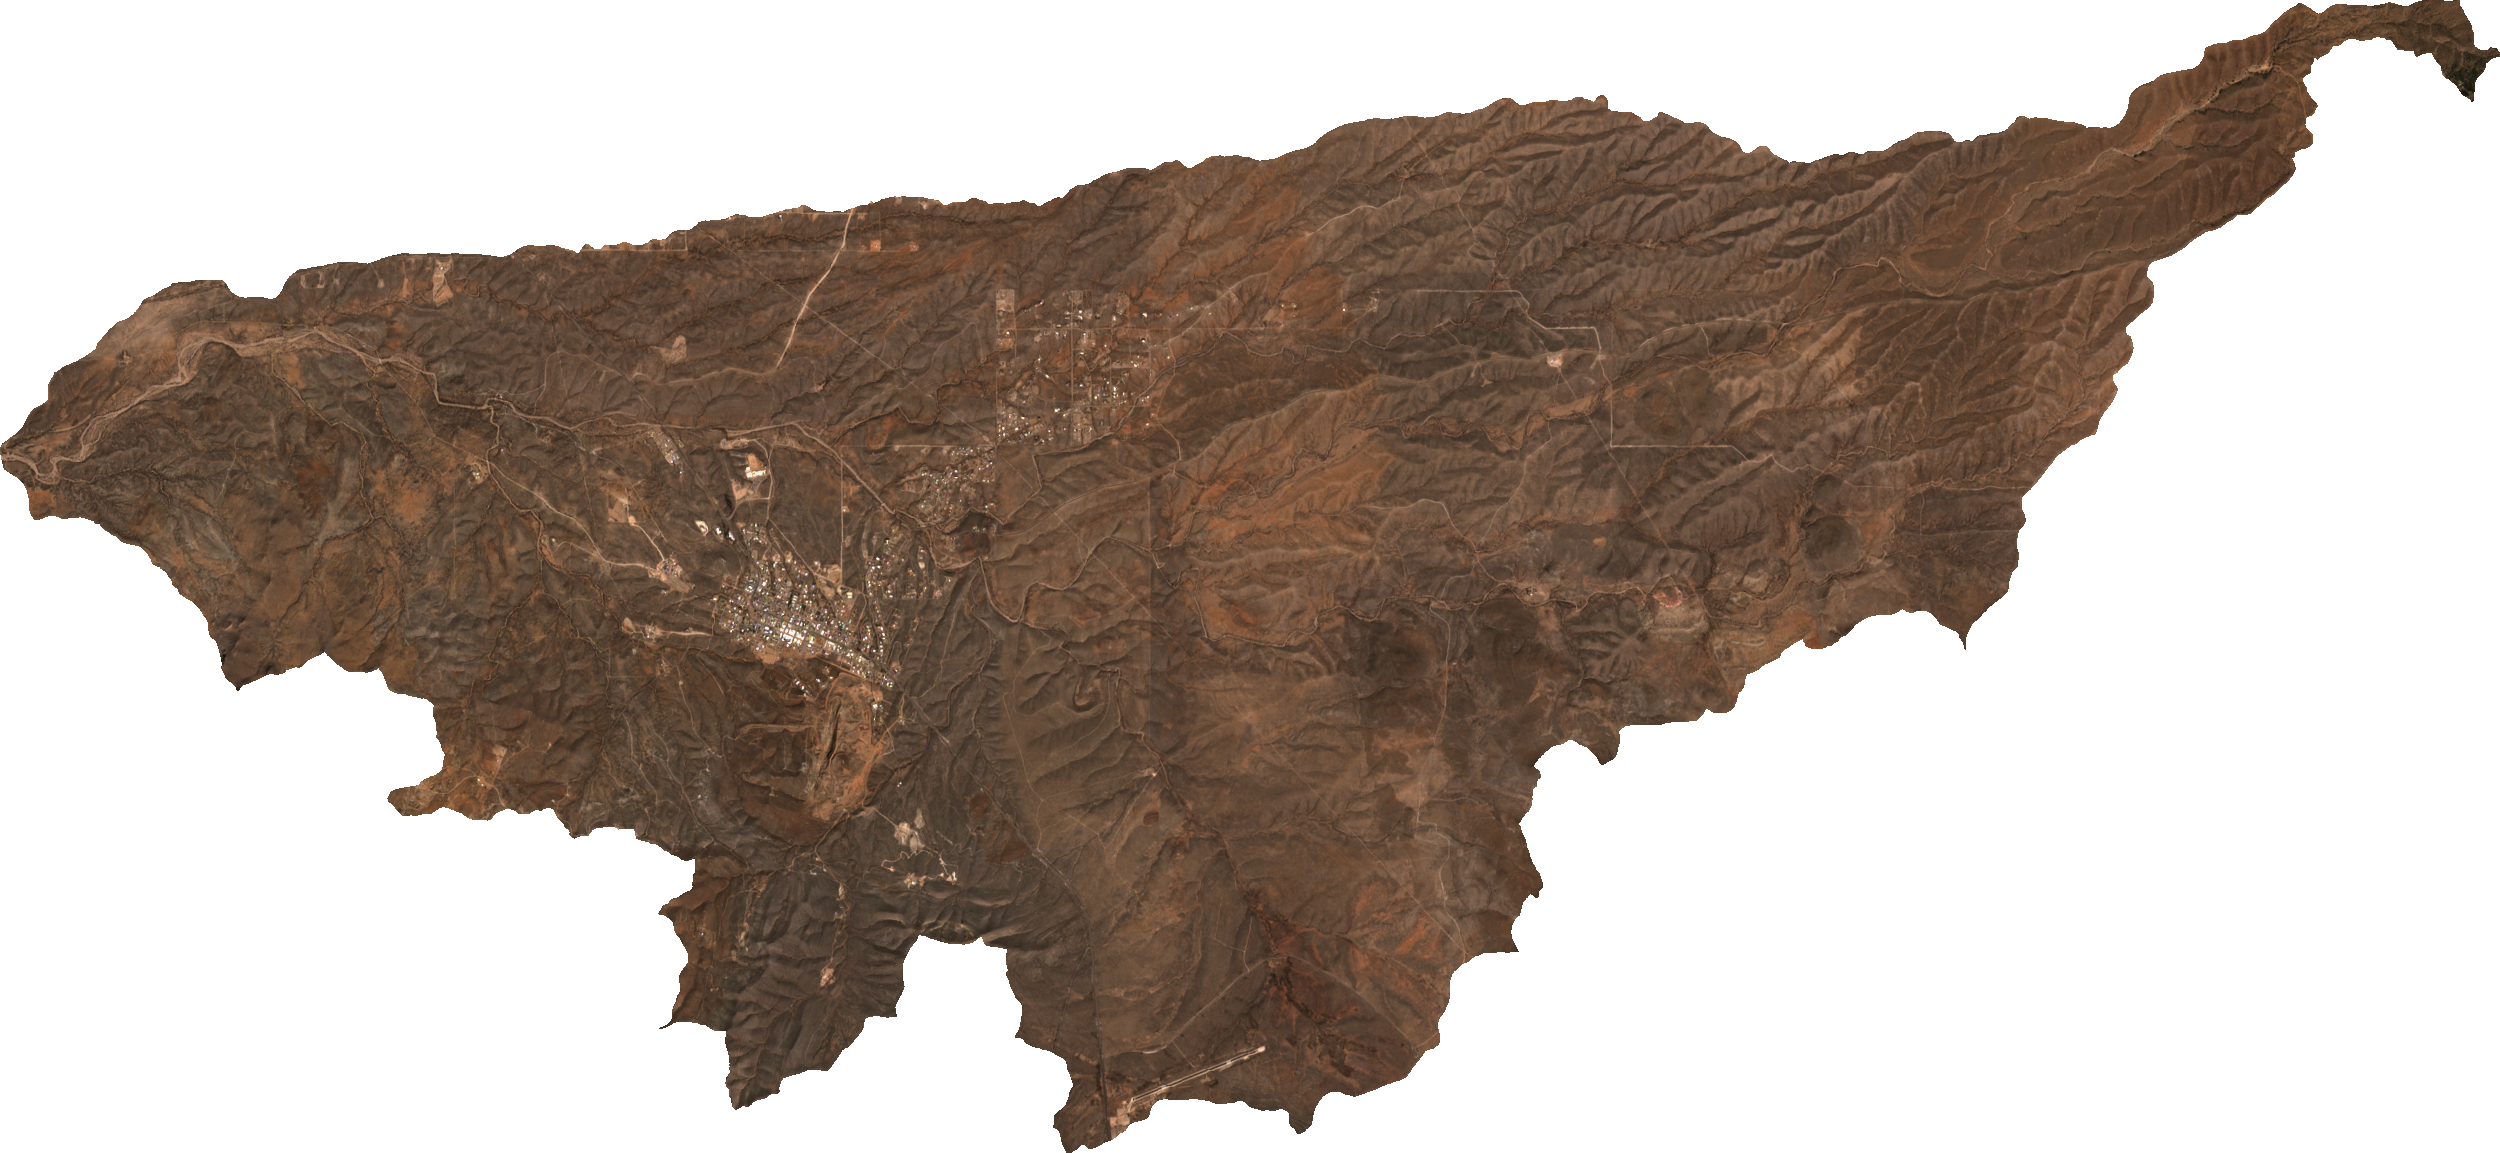
Only the Galnut Gulch Watershed area has been modelized, leaving aside Little Washita.
-
71 Sentinel2 BOA (Level 2A) images from 2019 were used, in contrast to the 17 images corresponding to the year 2015 used in the article. Because of BOA level, radiometric, atmospheric and geometric corrections were not needed.
-
The Sentinel2 SCL band was used as a single mask to filter water bodies, clouds, saturated pixels, etc, as a consequence, the clustering and water body classification models of the original article were not necessary.
-
Both methods for the estimation of the \(\theta_d \) , \(\theta_w \) coefficients, corresponding to the two scenarios presented in the original article have been implemented, although only the first scenario is fully developed.
Adittionaly in some parts, the implementation makes advantage of parallel computations to process the tens of millions of data to be computed in a single computer.
Data fusion
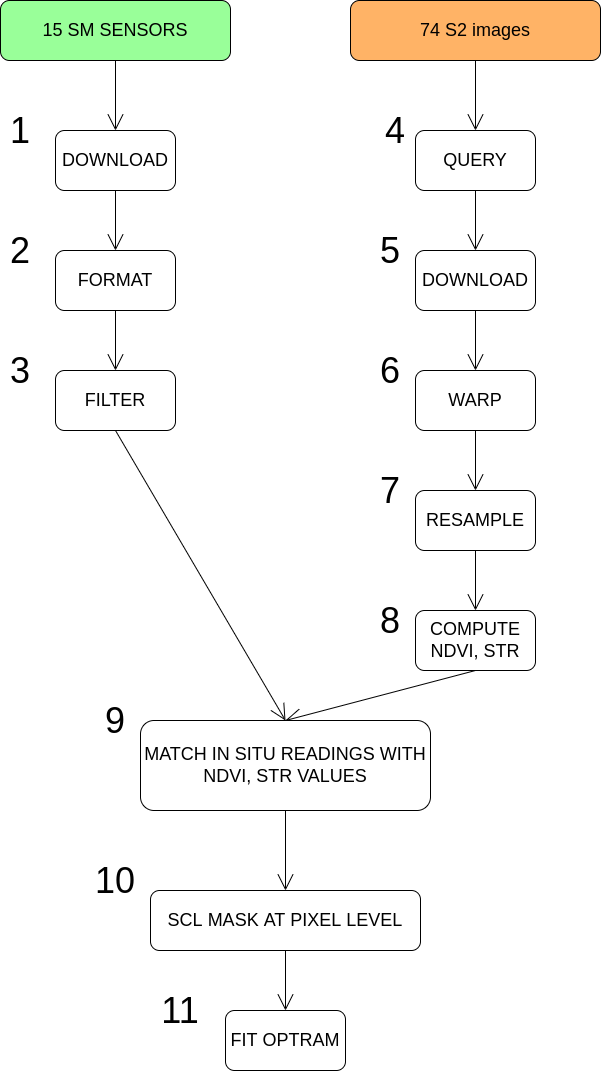
- 1-3 : Sensor processing, the filtering of incomplete sensors will be performed here.
- 4-8 : Very complex but made easy by sen2r library in R, rasterio and gdal in python.
- 9 : This data fusion is key to obtain a full implementation of the OPTRAM model. The sensor readings of each station are matched with the nearest pixels of each image at the acqusition time, allowing for volumetric content water (%) predictions once the model is validated. Aditionally a big speed up is achieved using the parallel library Dask.
- 10 : The Scheme Classification Layer (SCL) already computed by Copernicus is used to mask the defective pixels, i.e., clouds, snow, shadows, etc.
- 11 : Finally, with the filtered data and inSitu fusion observations the OPTRAM can be fitted.
NDVI-STR space
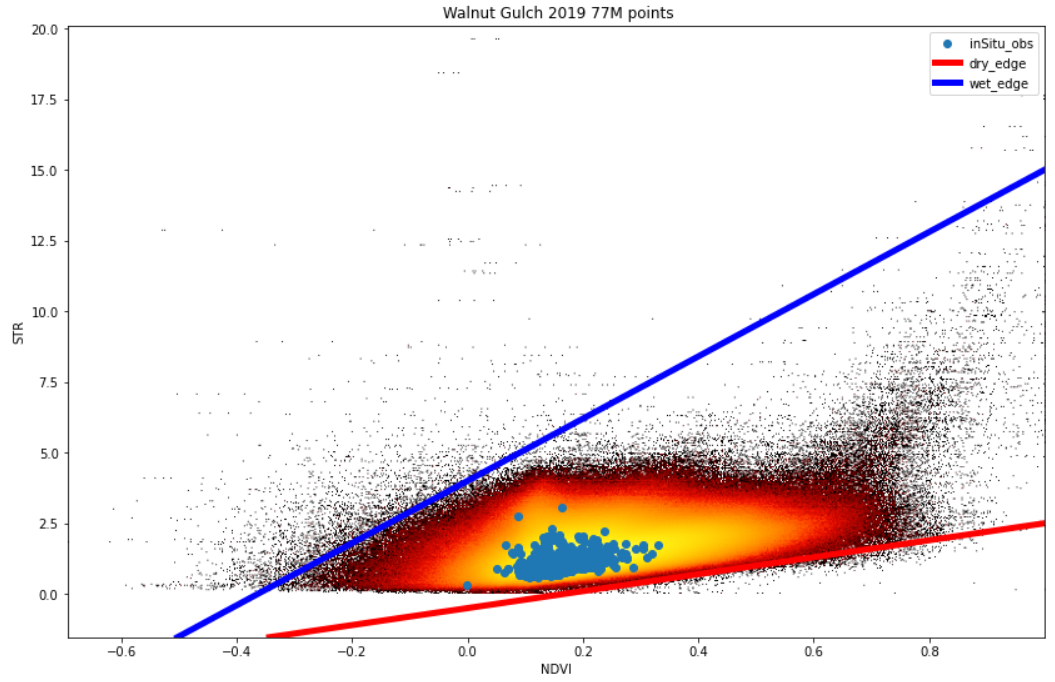
The higher range of NDVI (>0.4) values is orphaned of measurements, this will introduce additional uncertainty when actually satured pixels are confronted with the OPTRAM for predictions.
Results
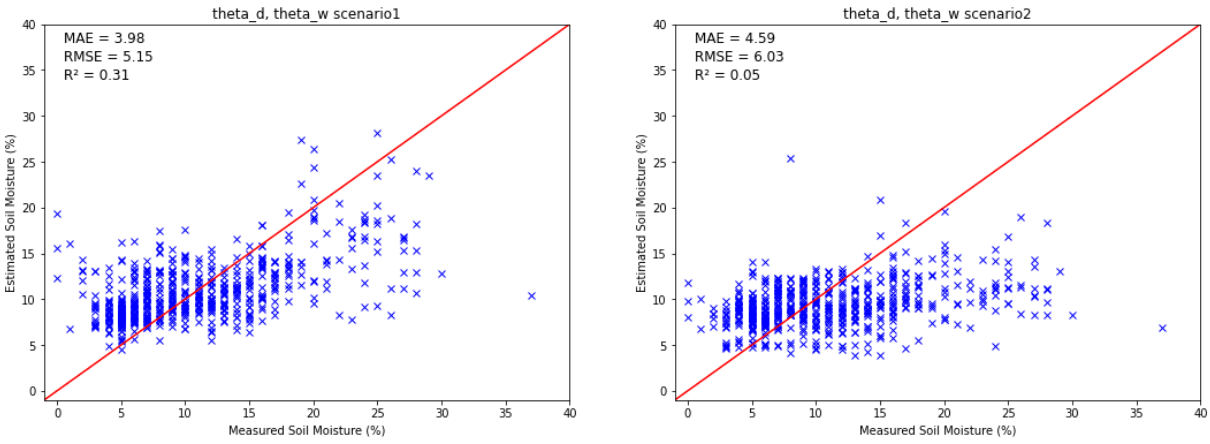
𝜃 values estimated by linear regression analysis (scenario 1) led to better results, but obviously some underfitted stations are having a very negative effect, learn more about it in the notebook.
W maps
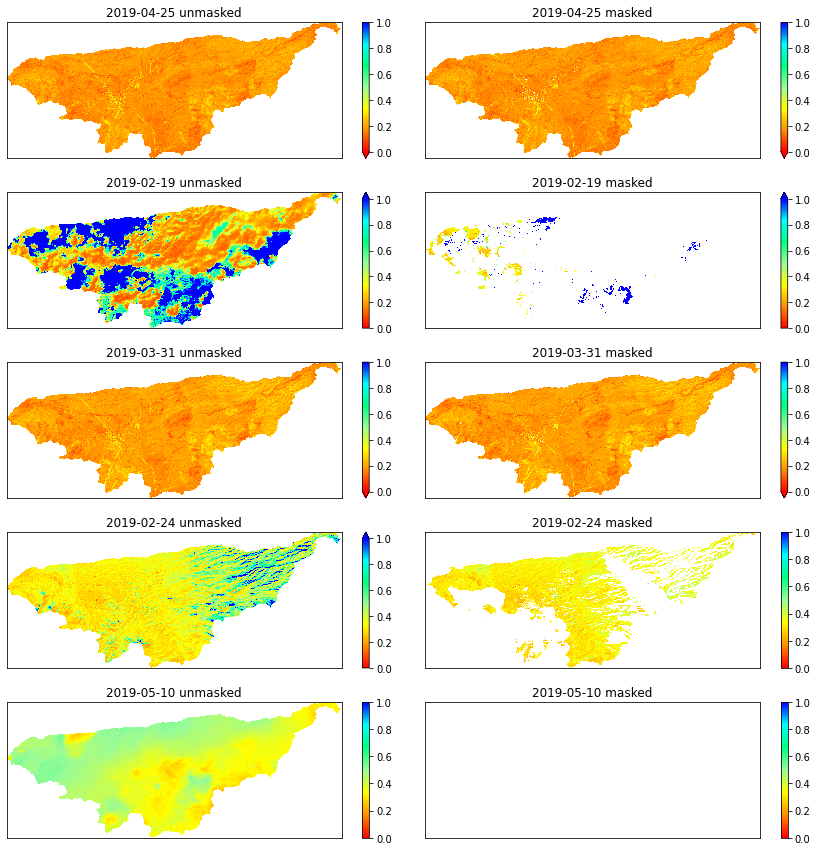
Its to be noted that the W maps are not in volumetric units, this is achieved by applying the regression model \(\theta\) ~ \(W\), but its not cover by the original paper. In a coming notebook several alternatives to obtain the volumetric \(\theta\) maps will be implemented.